Tracers
Stability: EXPERIMENTAL, expect breaking API changes on minor v0-v1 releases and major v2+ releases ]
Tracers are a special type of child logger that automatically log extra telemetry with all logged messages. Tracer is a
subclass of Logger, so you have access to all the regular Logger methods, plus several additional ones described below.
You need to ensure you are logging at DEBUG level in order to see trace data.

Tracing Factory Methods on Logger (and Tracer)
The traceId and spanId properties use identifier formats that conform to the W3C and OpenTelemetry specs for Trace Contexts.
logger.tracer(operationName, options)       // create a new Tracer as a child of this Logger
logger.trace(operationName, asyncFunction)  // create a new Tracer and "run" the asyncFunction provided
logger.instrument(classInstance, options)   // wrap each public method on the instance with a tracer run
Tracer Option Properties
all regular Logger options, plus:
autoLog- whether the tracer should automatically log start/end eventsautoLogSeverity- level for autoLog output (defaults toDEBUG)timeoutMs- automatically end trace spans that run this long, defaults to 30 secondstraceContextStorage- (advanced) async storage for propagating trace data through async call chainscapturedTraceContext- (advanced) used internally when aTraceContextwas pre-createdpreferActiveContext- (advanced) use the async call stackTraceContexteven if this tracer's parent is also a tracer
Tracer Creation and Usage
Tracers start tracing as soon as they are created, and stop either explicitly when their end() method is called,
or implicitly when the async function they are tracing returns.
Tracers are created using factory methods on a parent logger. Here's an (overly verbose) example of using a Tracer:
const logger = new Logger('example');

async function slowFoo() {
  let slowTracer = logger.tracer('slow-foo');
  await setTimeout(1000);
  slowTracer.end();
  return 'foo!';
}

async function foo() {
  let fooTracer = logger.tracer('foo');

  try {
    const result = await slowFoo();  // in this example, slowFoo will *not* have access to the fooTracer context!
    fooTracer.end();                 // with an unmanaged tracer, you need to make sure to end the trace manually
    return result;
  }
  catch (err) {
    fooTracer.end(err);              // pass an error to .end to mark the trace as an error
    throw err;
  }
}
This is such a common pattern that the library provides several ways to simplify it. The async run method of the Tracer
wraps the trace context such that any tracers created anywhere below in the async call chain will inherit it!
const logger = new Logger('example');

// this is the basic approach
async function foo1() {
  let fooTracer = logger.tracer('foo1');

  return fooTracer.run(async () => slowFoo()); // slowFoo will now magically inherit async trace context!
}

// this is a shorthand syntax for the same as above
async function foo2() {
  return logger.trace('foo2', async (tracer) => slowFoo())
}
In some cases, the run trace context can be set up at a high level, such as in web service middleware,
keeping it somewhat out of view. In other cases, one might (understandingly) find it architecturally
distasteful to restructure application logic in order to accommodate tracing. In the case where classes
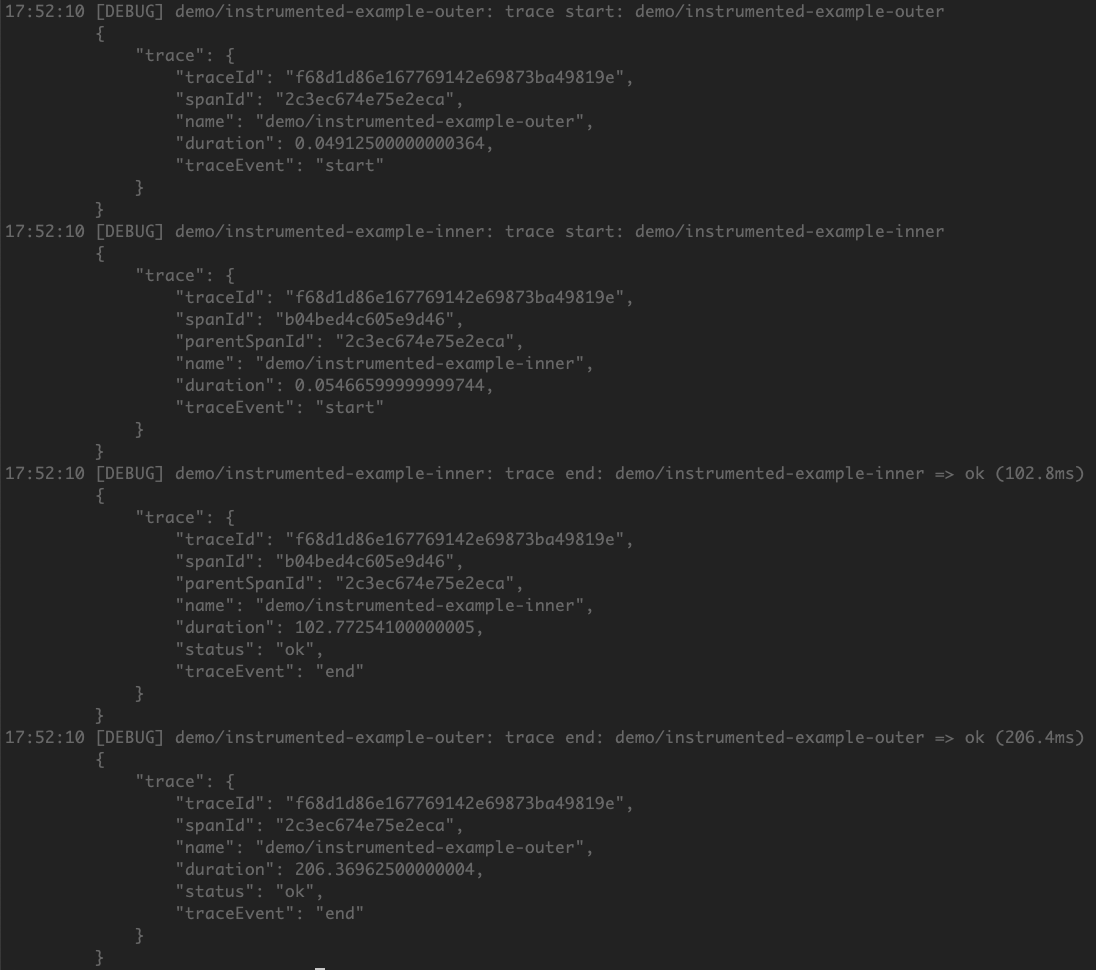
are used to package up functionality, there is the option of calling logger.instrument(instance), which
will dynamically wrap all public methods with tracers, keeping the base implementation unsullied by
unsightly tracing boilerplate:
const logger = new Logger('example');

// class is implemented without any explicit tracing
class FooService {
  async foo() {
    return slowFoo();
  }
}

let fooService = new FooService();
logger.instrument(fooService);           // this will wrap each public method in a tracer

const result = await fooService.foo();   // this will now automatically log DEBUG-level trace telemetry
The instrument call can be passed options to include/exclude methods and otherwise change its behavior;
logger.instrument(instance, instrumentOptions);
Instrument Options
methods- null = all methods, or pass an array of methods to includeexclude- array of methods to exclude; default is['constructor']prefix- prefix to prepend to operation names; useful if instrumenting via a higher level loggerfield- a property containing the active tracer that will be injected into the instance during the call; default is"logger"